Webfleet Solutions’ Paul Verheijen and Geotab’s Mike Branch reveal all on the collaboration to create the Commercial Mobility Recovery Dashboard.
Launched in May in response to the COVID-19 pandemic, the Commercial Mobility Recovery Dashboard is a new tool created in collaboration between Bridgestone’s Webfleet Solutions and Geotab, two global leaders in connected transportation, mobility, and telematics.
The dashboard, which was explicitly designed in response to the global outbreak, analyses data from more than three million connected vehicles across Europe and North America to help fleets better understand the pandemic’s impact on their activity and to support their recovery efforts.
To help shed insight on the development of the dashboard, findings to date, and what can be expected from it in the future, we spoke to Webfleet Solutions’ VP Product Management, Paul Verheijen, and Geotab’s VP Data & Analytics, Mike Branch.
How did this project first come into existence?
Paul: We (Webfleet Solutions and Geotab) share the belief that our data can be used for good. Not only in a way to create value for our customers to optimise fleet operations but also to help shape decisions and innovations in our society. Especially in these challenging times, the access to aggregated vehicle data is a vital component in analysing the impacts on our economy.
After much analysis, we have found that counting the number of trips, measuring the total driven mileage, or measuring the total operational time leads to similar conclusions with respect to describing overall activity. We decided to combine our anonymised and aggregated data analytics to create this dashboard.
We both wanted to help government and business decision makers make sense of the current commercial environment and provide a reliable source of information for insights that can help steer decision making.
What are your key findings from the dashboard to date?
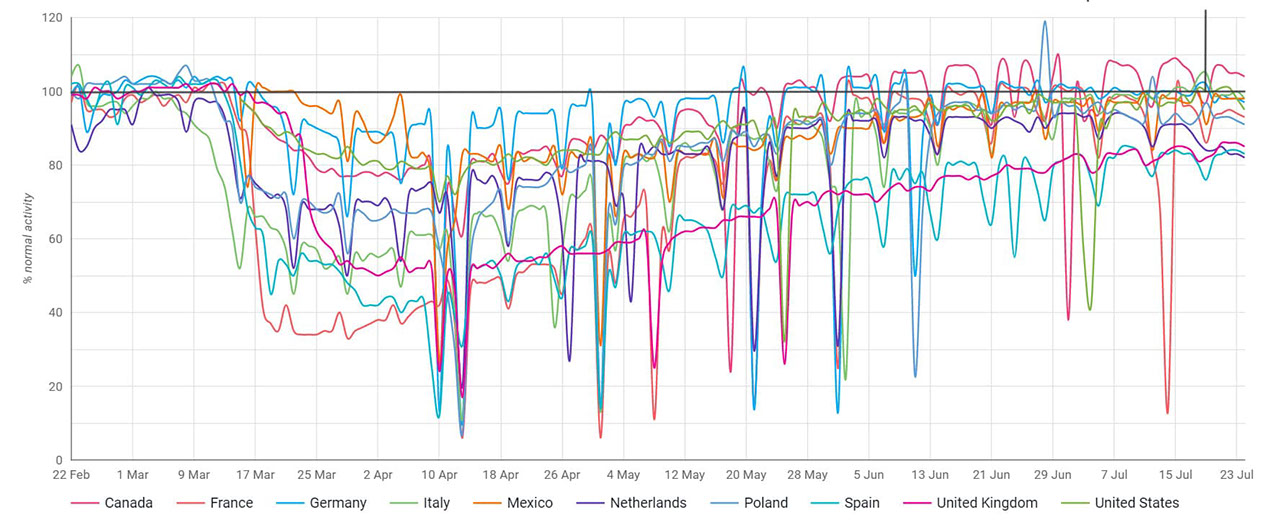
Paul: Overall, the dashboard has reported positive trends regarding how fleet activity is recovering across Europe and North America. Since we launched the tool, we’ve seen steady week-on-week growth in all countries. Given the severity of the pandemic, it has been a remarkable effort from the global supply chain and fleet industry.
Canada, Germany and France, for instance, have returned to pre-COVID-19 baseline activity levels – or even higher – by July. Italy, Mexico, the Netherlands, Poland, and the USA are all clearly above 90 per cent. For Spain and the UK, commercial vehicle activity is still lower, currently at around 80% of normal. Though both countries have also trended upwards since the launch of the dashboard.1